D-Day! It’s Time To Show That Demo


We made it! After twelve weeks of hard work and many struggles with unforeseen obstacles, our team of five Harvard students has made it to this critical point. We are about to present to our client, the New York City Department of Buildings, the result of our course “Tech and Innovation in Government” at Harvard Kennedy School. It is finally Demo Day!

NYC Blog6 2.jpeg

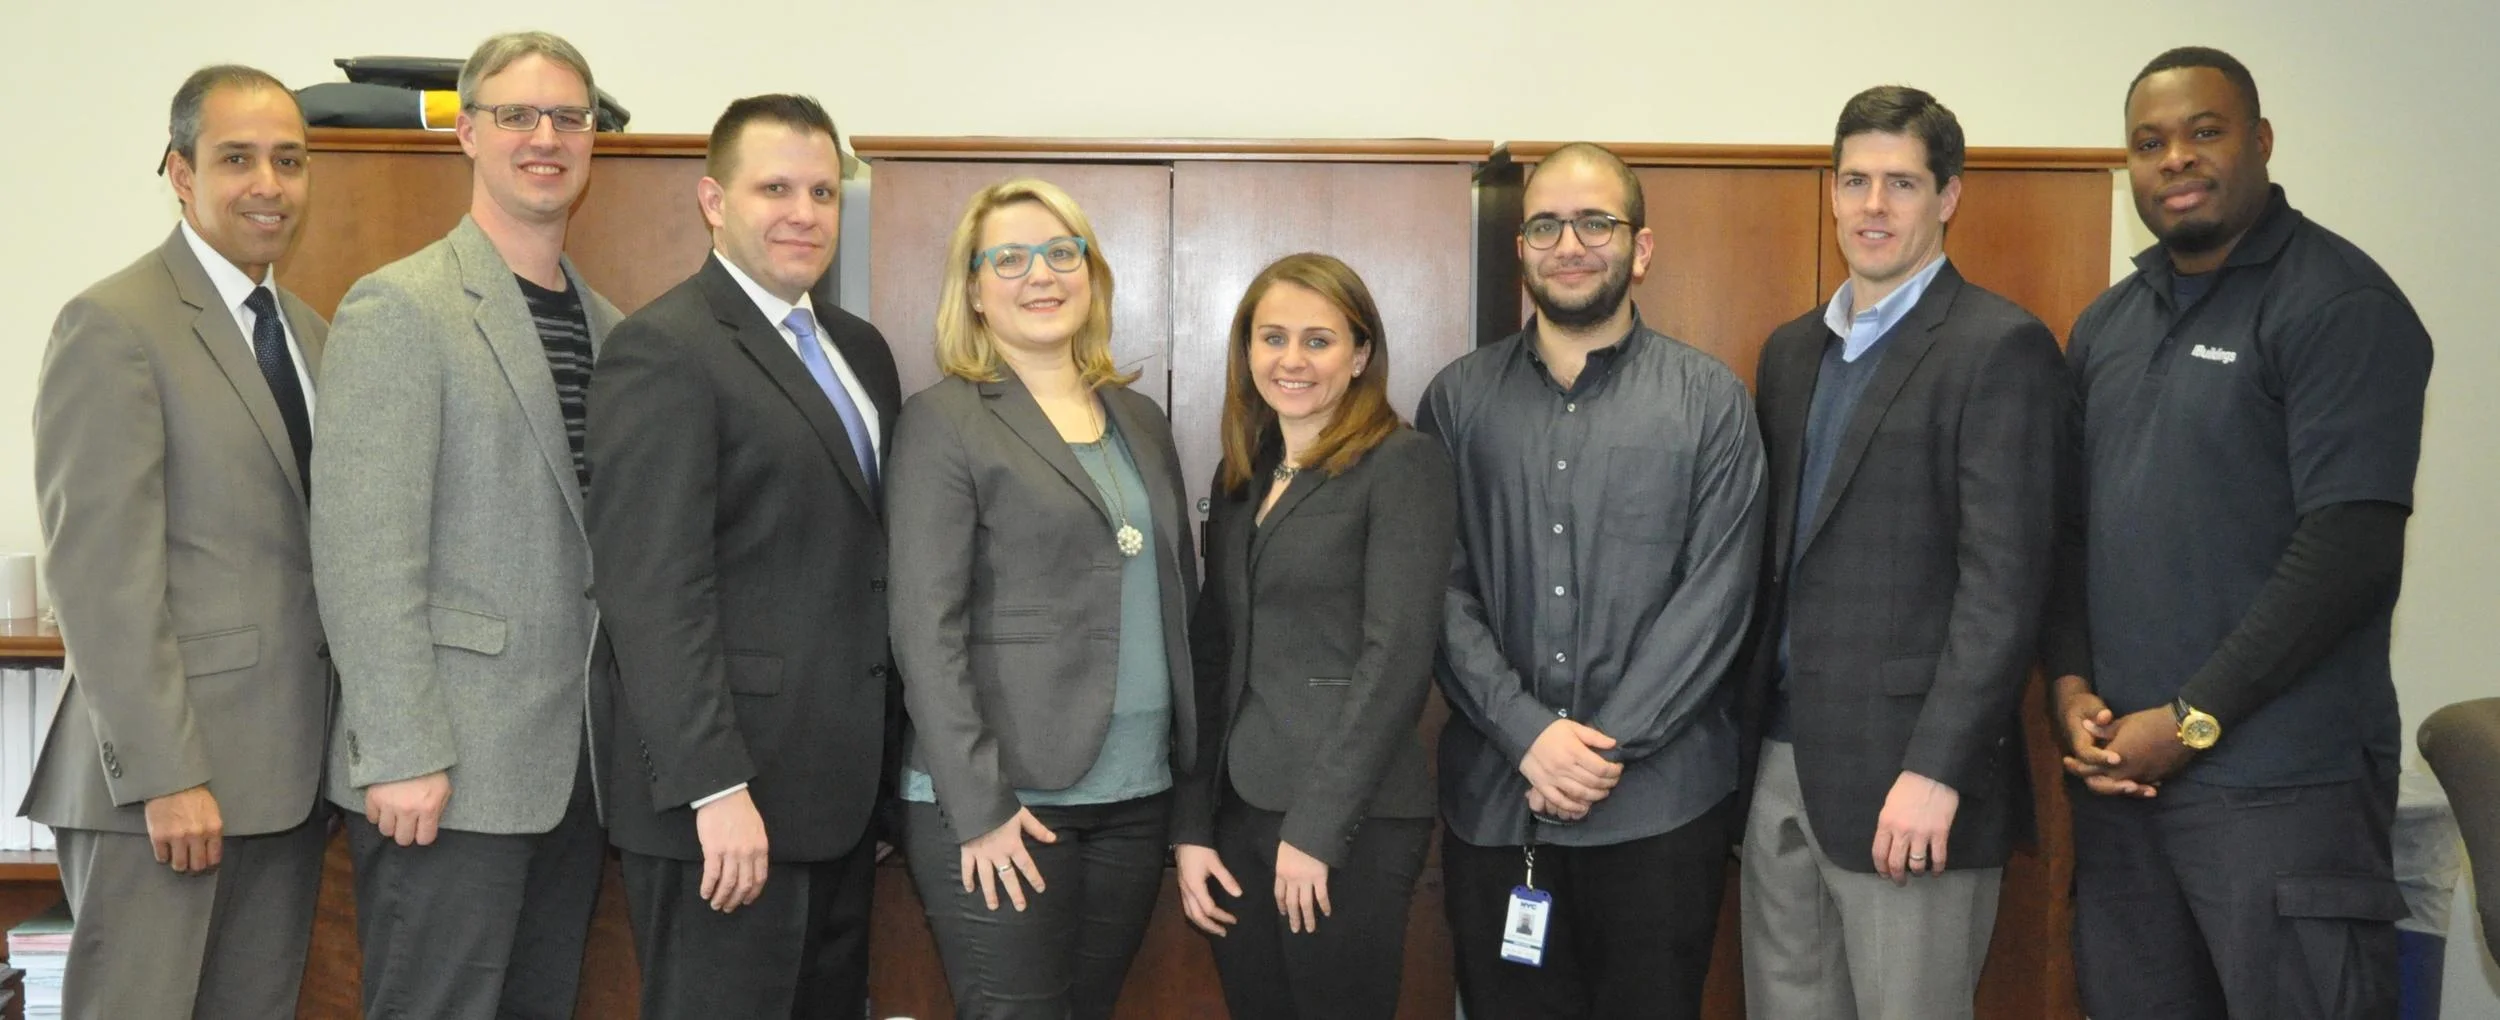
When we embarked on this class and the project for the Department of Buildings at the end of January, every team member brought a different skillset to the table: Anthony Arendt had just finished a course in design thinking. The Daniels in the team, Daniel Bacon and Daniel Wagner, were both keen data analysts. In addition, Dan Bacon had a coding background, while Daniel Wagner’s training in policing added important experiences to team discussions. Howaida Kamel contributed her expertise in design, urban planning and data analysis, while Kirsten Rulf brought a decade-long experience in journalism to the table, including proficiency with thousands of interviews and storytelling.

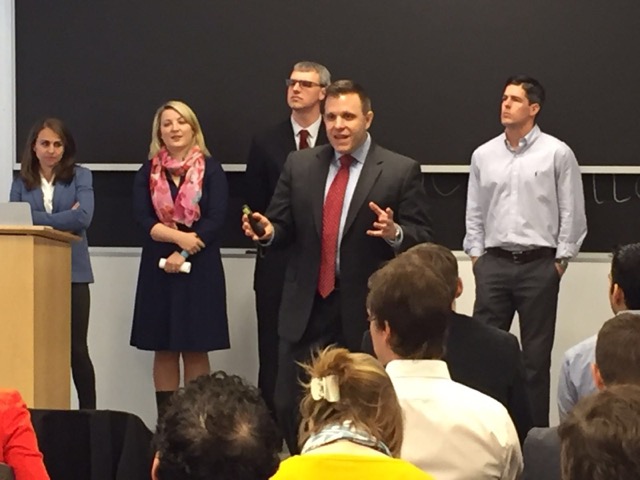
At times, it was hard to see how we could combine these diverse skills effectively for prototyping. Working together has been one of the big challenges of the course with team members from two schools, four different courses, and five different schedules. Identifying the right users has been another one. But today, on the last day of the class, the demo day, we are proud to get up from our front-row seats as a team and present not one, but two prototypes to our client Rey Cabrera and the audience of Harvard faculty, students, friends and family in the Harvard iLab.     

Digital Form Prototype

Early on in our user research journey, we discovered that the form that inspectors use to document building accidents was too complex. Hardly anyone used the paper form, because it was just impractical. Our prototype of a digital form offers inspectors a much simpler and faster way to enter accident information. Using Qualtrics, we built survey that inspectors can fill out on a tablet and that automatically links the data to the database.

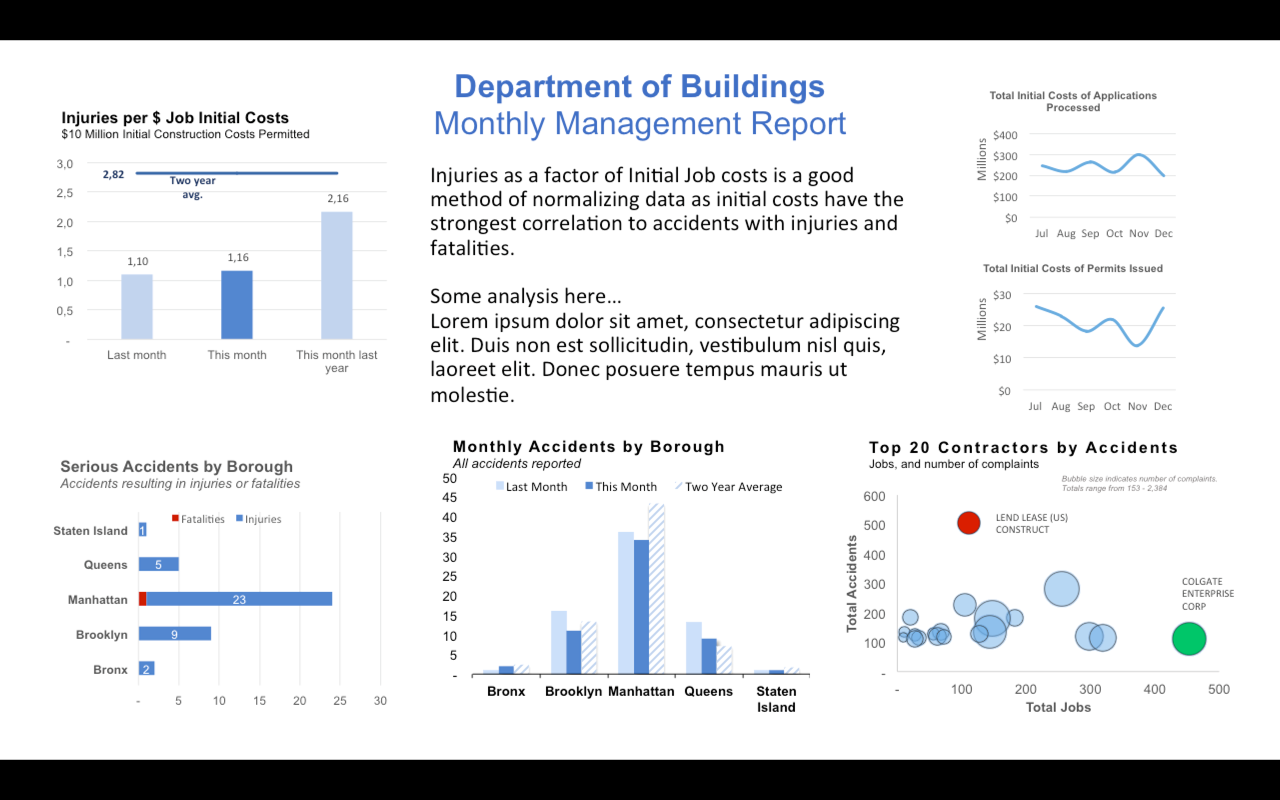
Management Dashboard Prototype

During the last three weeks of the course, we extensively tested the idea of a graphical representation of the most important accident data for managers. We set several versions in front of our users. The result is a two-page weekly safety report.

Both prototypes have the potential for scaling. So alongside the two prototypes we provided the Department of Buildings with a set of actionable recommendations. They include the suggestion to hire more data analysts that can recreate our weekly safety brief and the proposal of a process for solid data collection and assessment. As our twelve weeks with the Department of Buildings come to an end, we hope that our ideas will help them continue on their important mission to make New York City construction sites a safer place for everyone.  

Anthony Arendt, Dan Bacon, Howaida Kamel, Kirsten Rulf and Daniel Wagner

Iterations and Surprises


The final week in our student project for the New York Department of Buildings (DoB) has begun! Eight weeks ago our team of five Harvard Kennedy School students kicked off a user research process to help the DoB improve construction safety.

Specifically, the DoB wants to use data on past accidents to reduce accidents on construction sites in the future. We spent the past couple of weeks finding the right indicators for safety, crunching numbers, and designing a dashboard. From a rough sketch on a piece of paper we developed this four-page prototype in power point to present to three managers in the DoB.

Last Monday, we put this prototype in front of DoB manager for the first time to test how well it met user needs. We wondered: which of our graphs are most helpful for our users in preparation for a management meeting?  And have we presented the data in a form that is easy to grasp in their very short time available as busy DOB managers?

We emailed the prototype to our users only minutes before we called them, to mimic the actual time they usually have to engage with an analysis before a meeting. Then we followed them in real-time on the phone as they worked their way through the prototype, marked how their eyes traveled over the paper, and noted their reactions to each part of the dashboard in different colors.

Our users (DoB safety managers) had near unanimous feedback on our prototype. For example:

  • They all wanted us to cut the graphs on the upper left corner and the upper right corner of the page out of the dashboard. Their reactions to the graph on the upper left side were strong and very similar. They said “this is not at all helpful!”, “I am never asked for this information”, or “this is not important to me.”
  • The users wanted a short summary of the most important results in the middle of the page.
  • The fonts were mostly too small for them.

Our next step is to review the design choices we made, rework the prototype, and user-test before our final class, Demo Day. We want to present the same data, more clearly in the next iteration of the dashboard. We intend to test an important question: were the graphs confusing or was that masking a larger problem of the actual data not being useful?

Anthony Arendt, Dan Bacon, Howaida Kamel, Kirsten Rulf and Daniel Wagner

Data, Safety & New York City: Our User Research Journey


Minutes into our interview with one of the most experienced managers at the New York City Department of Buildings, he confessed: “To put it bluntly, it’s just too complicated.” The manager was referring to the DoB’s process to collect data about accidents on construction sites.

We, a team of five graduate students at Harvard Kennedy School, are working with the DoB on a research project to determine how the department can reduce construction accidents.

Throughout the previous week, our team had researched how accident and safety data moves through the DoB. We discovered that they have an extensive accident database, but the information in that database is neither complete nor useful.

We called twelve DoB managers at the department to find out what changes they would like to see in the database to make it useful for them.

Insights from DoB Veterans

Reflecting on decades of experience, there is consensus among most senior DoB managers: they would love to see leading indicators of high-risk types of construction. For example, is a construction site more dangerous in Queens than in Manhattan? Are construction sites above a height of ten stories more hazardous than sites below ten stories? If they had those trends, most managers said, they could purposely send their inspectors to those higher-risk types of constructions. But right now, DoB managers cannot see any trends in the data, because the database is useless for that purpose.

Three key problems come up in our conversations again and again:

  • The accident database is often described as “confusing”, “cryptic”, “messy”, and “unclear”.
  • Most people in the DoB are focused on enforcing the building code and issuing permits, not on preventing accidents or increasing worker safety.
  • Over the years, the majority of accident information has been captured and shared internally at DoB via email, despite the existence of a accident database. Lacking a useful database, DoB managers have no basis to inform them where best to send their limited number of inspectors.

Next Steps: Brainstorming and Prototyping

One option our team is now considering is to build a predictive tool on incomplete and messy data. A more productive route, however, might be to make the accident database more usable for DoB. Our next step is to explore a technical solution that will enable DoB to bring order to the chaos of its accident database.

Anthony Arendt, Dan Bacon, Howaida Kamel, Kirsten Rulf and Daniel Wagner

From Accident to Insight: How the Data Flows


Finally New York City! Last week, our Harvard Kennedy School team of five students took the train down to The Big Apple to meet with representatives from the New York City Department of Buildings (DoB) and the Mayor’s Office of Data Analytics (MODA).

Our main goal was to understand what happens within the DoB once an incident occurs. Specifically, how exactly is incident data collected, stored, and analyzed? Also, how is this data used—and by who?—to carry out the DoB’s mandate to prevent injuries and fatalities on construction sites within the five boroughs?

A Lengthy Process from Construction Site to Incident Database

One key finding from our visit is that there is a multi-step process before anyone can use incident data. The process from accident to usable data includes:

  • First, the DoB has an Emergency Operations Center (EOC) that receives complaint calls from those reporting construction site concerns in NYC.

  • Next, the incident is categorized by the EOC officer into an Oracle database that automatically pushes out an email to the respective borough office and unit responsible to follow up on the issue.

  • The head of the respective department then assigns an enforcement Inspection officer to visit the site and check it for building safety or environmental control board violations.

  • Next, the inspector emails his findings from the site to their respective supervisor, who then enters the findings into a separate MS Access database built to record incidents.

  • Finally, an analyst copies the data, and once a month, publishes the raw data on the website for public viewing as a PDF.

Three Critical Issues in Data Management

Our team has identified three main problems areas at the DoB:

  1. There is data input, but little output: While a lot of people are involved in collecting construction incident data at the DoB, it is not clear to us that this data is being analyzed or looked at again by someone within the organization.

  2. What is collected is mainly inspection data, not safety data: The recent implementation of an enterprise IT solution provides inspectors in the field with tablets to receive assignments and easily enter inspection findings. However, it does not give them access to the construction incident database, which makes it harder for them or others to input safety data remotely.

  3. Data by itself do not lead to action: The Department of Buildings provided us with a very clear goal: “dive deeper into incident and fatality data to develop an actionable, predictive tool…to avoid future accidents.” But before we start exploring predictive analytics, the question for our team remains: who should be seeing and using incident data? And, more importantly, what can they do with it to improve safety?

Next Steps

The next research phase for our team is to identify and interview a variety of people inside and outside of the DoB, including possibly the general public, front-line construction workers, DoB managers, and DoB leadership. Our goal is to understand the complex process of data collection, storage, analysis and dissemination in order to identify ways in which we can improve this process. We hope that our efforts will ultimately help the Department of Buildings make data-driven risk mitigation decisions, which would result in fewer construction related injuries and fatalities.

Anthony Arendt, Dan Bacon, Howaida Kamel, Kirsten Rulf, and Daniel Wagner

Can a City Government Prevent Crane Disasters?

 
Photo credit Andrew Gombert/APA

Photo credit Andrew Gombert/APA

David Wichs was a 38-year-old Harvard graduate who lived and worked in New York City. Earlier this month, while walking on Worth Street near his Manhattan home, David was killed by a falling 565-foot construction crane. He is one of 26 fatalities caused by construction accidents in NYC over the past four years.

This unfortunate accident took place on the very day we embarked upon a partnership with the Harvard Kennedy School and our client, the NYC Department of Buildings (DoB). Together, we hope to prevent fatal accidents like this one, along with the nearly 1,100 additional injuries reported this past year that were linked to NYC construction.

What Causes Construction Site Fatalities and Injuries in New York City?

Throughout this semester, our team will ask questions that that include:

  • What leads to construction fatalities and injuries in New York City?

  • Can we predict accidents associated with construction sites, which in-turn could help the DoB focus the necessary preventative actions?

  • Does the incident data gathered by the DoB reveal any clues or patterns leading up to a mishap?

  • Are there certain indicators that we can trace back to accidents, such as types of construction projects, building typology, areas of the city or certain time periods?

  • Are there signs that tell us a construction site culture is indicative of an impending incident? And if so, how could the DoB focus on those sites?

As a diverse team of five graduate students, we’ve set out to take on these issues over the next few months during our Technology & Innovation in Government course at Harvard Kennedy School. We each claim various skills in statistics, design, technology development, and project management.

Our client, the DoB, hopes that we will provide them with innovative ways of finding answers through technology and design. Ultimately, we hope to answer our most important question: can accidents like the crane disaster that killed David Wichs be prevented in the future? And if so, how?

A Client, a Team, and a Challenge

Rey Cabrera is the DoB’s Risk Management Officer and our client. With a career in criminal justice, he has successfully identified and fought gang crime in NYC using data analytics. We’re excited about the challenge ahead of us -- we’ll have to interview users, wade through incomplete and disjointed data, uncover new insights, build a minimum viable product of a tool, dashboard, or data visualization, and ultimately deliver actionable recommendations to the client.

Come the end of the semester, our recommendations could include policies, procurements, people or even public safety campaigns. In the end, our goal is for Rey and the DoB to confidently employ strategies that will help prevent future injuries and save lives in New York City.

Kirsten Rulf, Anthony Arendt, Howaida Kamel, Daniel Wagner, and Dan Bacon